Pelorus Engineering

Find the money your building is already spending.

Continuous energy analysis for commercial buildings — engineering-grade savings you can defend.

  • No sensors
  • No installation
  • No BAS integration project
  • No new software for your team to run

Your first building is analysed free: a screening-level report, one building per organisation, from whatever data you have. Interval or BAS data goes through Energy Agent; a year of bills goes through Utility Bill Analyzer. No commitment.

Energy Agent · one year of one meter
  1. MET-03After-hours operation$12,900 a yearThe units run until 11 pm, every night of the year.Found by an engineering rule
  2. MET-11Lighting on after hours$8,400 a yearCorridor, gym and site lights burn all night.Found by an engineering rule
  3. MET-04Weekends shaped like weekdays$13,600 a yearSaturdays and Sundays run the school-day schedule for nobody.Found by an engineering rule
  4. MET-05Anomalous peak demand$3,400 a yearFour afternoons set the demand charge for four months.Found by a statistical model
  5. MET-02Baseload creeping up$4,700 a yearThe night floor climbs all year. No single day looks wrong.Found by a statistical model
  6. MET-08Anomalous daily load shape$500 a yearThree days shaped like no other day this school has had.Found by machine learning
  7. $43,500 a year, in one ordinary school. Not one of them tripped an alarm.

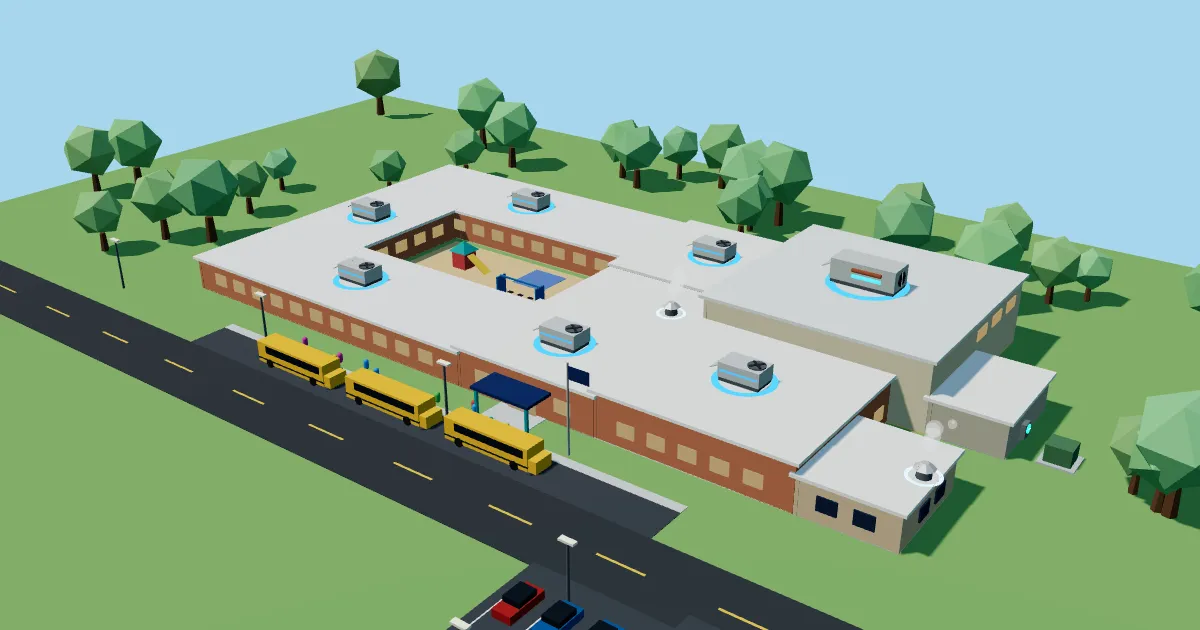
A year of one school’s electric meter, read in seconds. Engineering rules and machine-learning models find it; an engineer stands behind it. Watch these faults happen in the 3D school →

A synthetic school, simulated by the Energy Agent demo engine. Not a customer result.

See it happen

Then walk through the building.

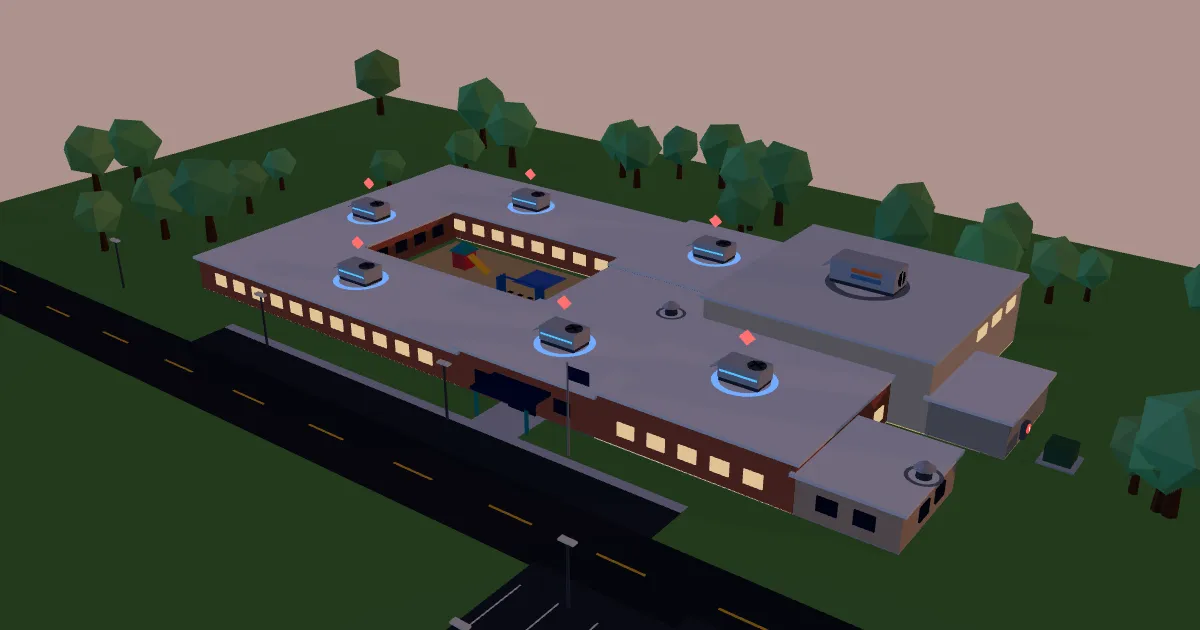
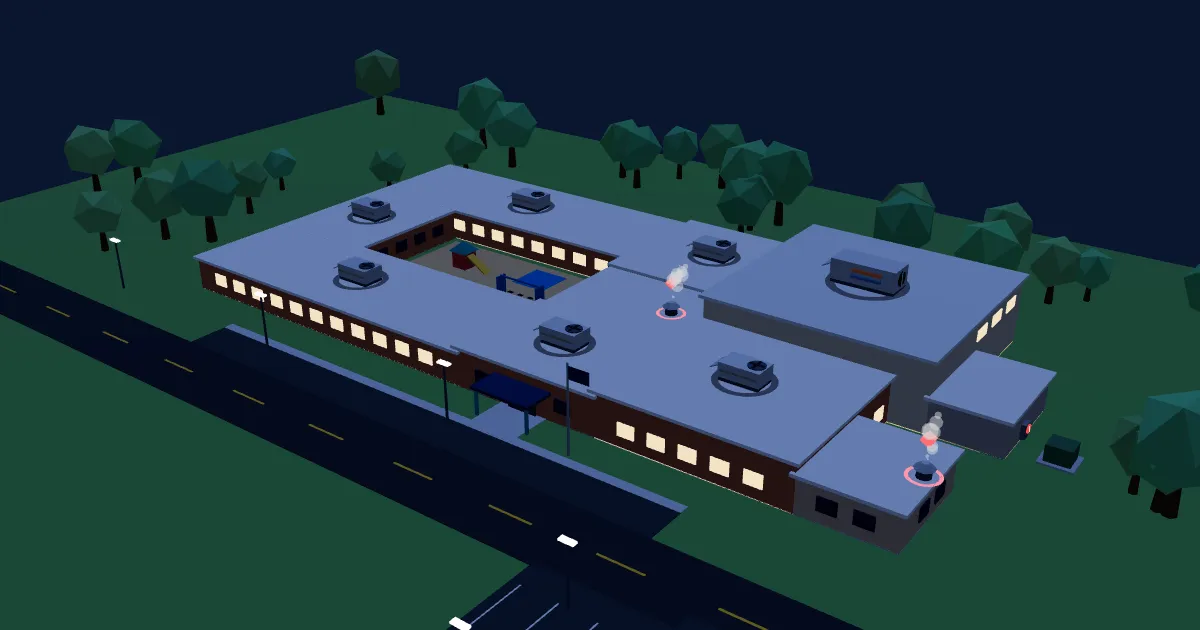
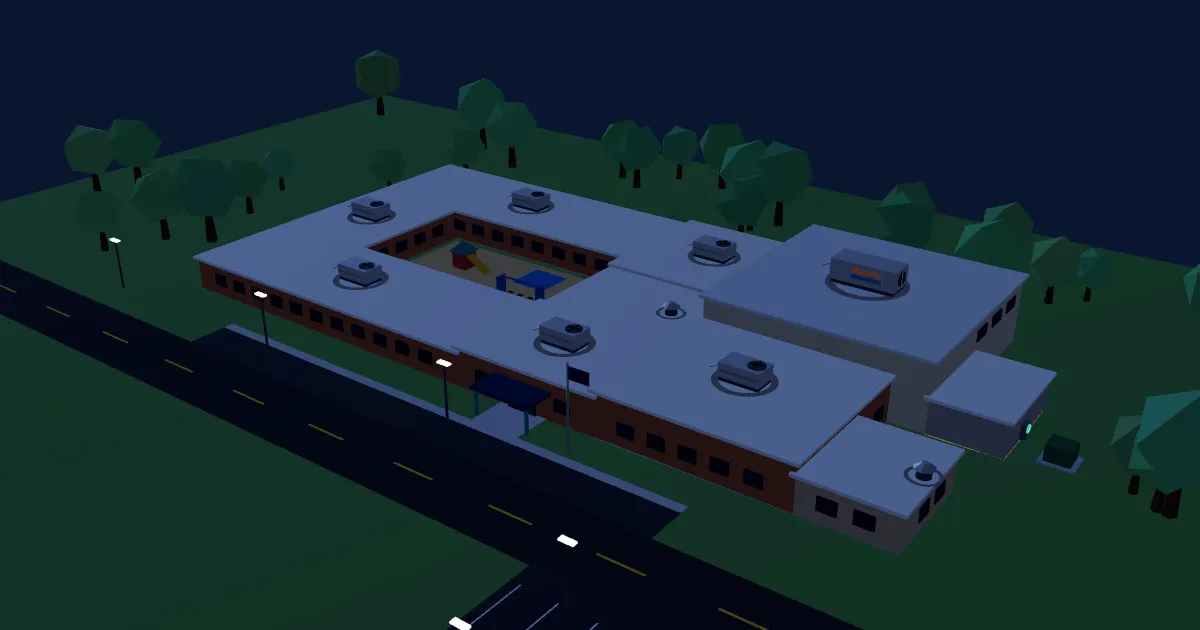
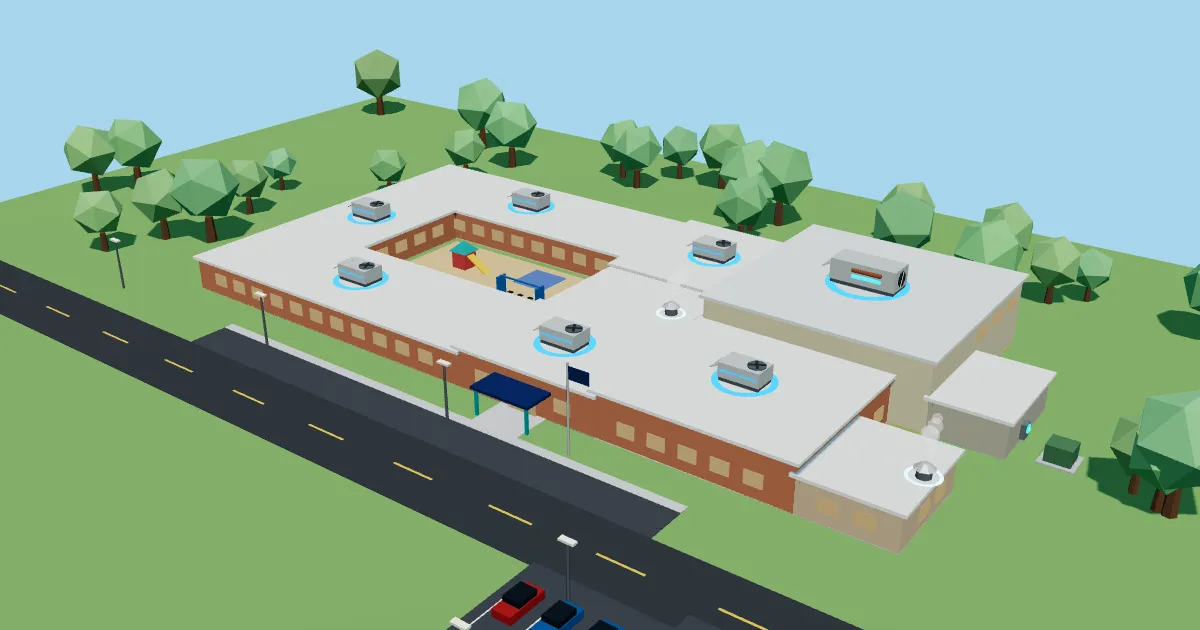
The same school in 3D, from before dawn to 2 am: watch the load follow the day, lift the roof, and switch on the faults the scan found. There is a campus plant and an air handler too, and three games to play in them.

How does your building rank?

Compare against 6,436 buildings in EIA's CBECS 2018 survey. Free, runs in your browser.

Your inputs go straight to the tool; nothing is stored here.

Don’t have a year of kWh or an EUI to hand? Send us the bills instead. Utility Bill Analyzer works out annual use, cost and EUI from them, and the first building is free. Start from the bills

The problem

Your building drifts, quietly.

  • Equipment falls out of tune slowly — nothing alarms, nothing breaks, the bill just creeps up.
  • Comfort complaints get fixed first. Overrides get left in place for years.
  • The data to catch it already exists — in your meter and your BAS — but nobody has a week to read it.
  • So efficiency work waits for a capital project, and the waste compounds every month.

Most of what we find costs little or nothing to fix. It just has to be found.

What we do

We find it, price it, and prove it.

You send us the data your building already produces. We return a ranked list of what is wasting money, what each item is worth per year, and what to do about it.

  1. Find

    96 automated fault rules read your meter and BAS data — air handlers, VAV boxes, chillers, RTUs, heat pumps, zones and the meter itself, including the Guideline 36 fault conditions FC01–FC16.

  2. Price

    Every fault is priced against your actual utility tariff — including demand charges — with the method and confidence stated on its face.

  3. Prove

    Each number opens into its own calculation, with the assumptions listed. Your engineer can check the arithmetic; finance can trust the total.

After the fix

Then the meter proves it.

A baseline model learns how the building uses energy from its own meter and the weather. Once a fix is made, the model says what the building would have used and the meter says what it did. The gap is the saving, reported with its uncertainty.

15,604 kWh verified over 100 days. 95% confident: 14,627 to 16,581 kWh. The saving built into this example was 15,620 kWh.

How savings are verified, with the worked examples →

fix made here

metered usewhat the model says it would have usedthe saving

A synthetic building with a known saving built in, so the method can be checked against the truth. Weekly averages. Not a customer result.

How Energy Agent works →

Products

Two products, one method.

Both run the same engineering analysis. One starts from your meter and BAS, the other from your bills.

Invite-only

Energy Agent

Find out what is driving your energy use

Pelorus connects your interval meter data, building automation trends and weather, then runs an engineering analysis that pinpoints schedules, setpoints and equipment faults behind the number you just saw. You get a ranked action plan with savings and payback.

Best when a building is underperforming and you want to know why.

Invite-only

Utility Bill Analyzer

Turn a stack of utility bills into a portfolio view

Send us your bills. Pelorus extracts every meter, tariff and charge, audits rates for errors, and benchmarks each site so you can see which buildings deserve attention first, without installing anything.

Best for portfolios, or when bills are the data you have. The first building’s screening report is free here too.

Free

Learn

Free tools and explainers, no sign-in

CBECS Explorer ranks your building against thousands of U.S. peers. The psychrometric chart walks through nine HVAC processes. The fault library explains all 96 rules, and the readiness quiz says which of them your data can run.

Built for engineers, operators and students.

Not sure what you have?

Find out what an analysis would cover before you ask for one.

Three minutes with the readiness quiz tells you how many of the 96 fault rules can run on the points you already trend, and which single point unlocks the most.

How it works

Nothing to install.

  1. You send data

    12 months of interval meter data. A BAS trend export too, if you have one — that is where the equipment faults live.

  2. We analyse

    Typically a few days. Weather-normalised, priced at your tariff, benchmarked against comparable buildings.

  3. You act

    A prioritised work list with owners and due dates, plus a report you can hand to finance without rewriting it.

Your team keeps doing its job. We run the analysis and bring you the findings.

Your first building is free.

Pick the one that bothers you most and send what you have: twelve months of interval data, a BAS trend export, or just the bills. You get a screening-level report of what is happening inside it and what it is worth. One building per organisation, no commitment to go further.